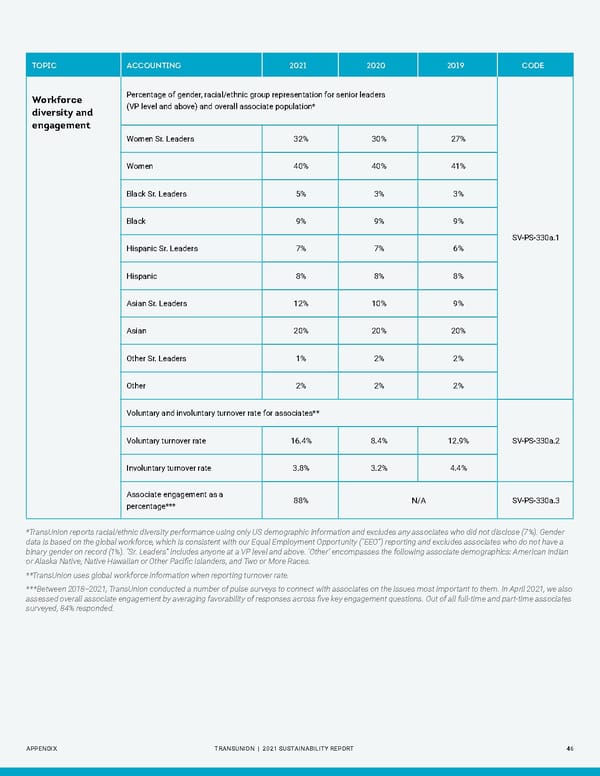
TOPIC ACCOUNTING METRIC 2021 2020 2019 CODE Percentage of gender, racial/ethnic group representation for senior leaders Workforce (VP level and above) and overall associate population* diversity and engagement Women Sr. Leaders 32% 30% 27% Women 40% 40% 41% Black Sr. Leaders 5% 3% 3% Black 9% 9% 9% SV-PS-330a.1 Hispanic Sr. Leaders 7% 7% 6% Hispanic 8% 8% 8% Asian Sr. Leaders 12% 10% 9% Asian 20% 20% 20% Other Sr. Leaders 1% 2% 2% Other 2% 2% 2% Voluntary and involuntary turnover rate for associates** Voluntary turnover rate 16.4% 8.4% 12.9% SV-PS-330a.2 Involuntary turnover rate 3.8% 3.2% 4.4% Associate engagement as a 88% N/A SV-PS-330a.3 percentage*** *TransUnion reports racial/ethnic diversity performance using only US demographic information and excludes any associates who did not disclose (7%). Gender data is based on the global workforce, which is consistent with our Equal Employment Opportunity (“EEO”) reporting and excludes associates who do not have a binary gender on record (1%). “Sr. Leaders” includes anyone at a VP level and above. ‘Other’ encompasses the following associate demographics: American Indian or Alaska Native, Native Hawaiian or Other Pacific Islanders, and Two or More Races. **TransUnion uses global workforce information when reporting turnover rate. ***Between 2018–2021, TransUnion conducted a number of pulse surveys to connect with associates on the issues most important to them. In April 2021, we also assessed overall associate engagement by averaging favorability of responses across five key engagement questions. Out of all full-time and part-time associates surveyed, 84% responded. APPENDIX TRANSUNION | 2021 SUSTAINABILITY REPORT 46
 Sustainability Report | TransUnion Flipbook Page 45 Page 47