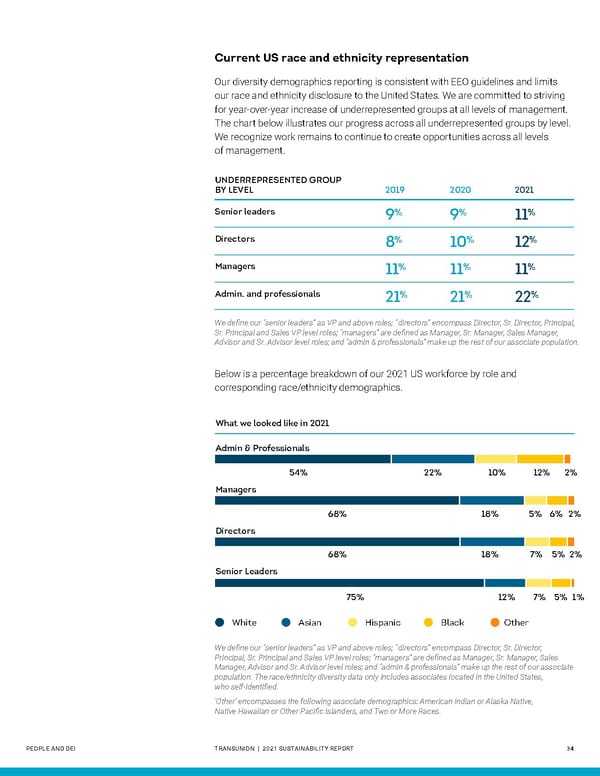
Current US race and ethnicity representation Our diversity demographics reporting is consistent with EEO guidelines and limits our race and ethnicity disclosure to the United States. We are committed to striving for year-over-year increase of underrepresented groups at all levels of management. The chart below illustrates our progress across all underrepresented groups by level. We recognize work remains to continue to create opportunities across all levels of management. UNDERREPRESENTED GROUP BY LEVEL 2019 2020 2021 Senior leaders % % % 9 9 11 Directors % % % 8 10 12 Managers 11% 11% 11% Admin. and professionals % % % 21 21 22 We define our “senior leaders” as VP and above roles; “directors” encompass Director, Sr. Director, Principal, Sr. Principal and Sales VP level roles; “managers” are defined as Manager, Sr. Manager, Sales Manager, Advisor and Sr. Advisor level roles; and “admin & professionals” make up the rest of our associate population. Below is a percentage breakdown of our 2021 US workforce by role and corresponding race/ethnicity demographics. What we looked like in 2021 Admin & Professionals 54% 22% 10% 12% 2% Managers 68% 18% 5% 6% 2% Directors 68% 18% 7% 5% 2% Senior Leaders 75% 12% 7% 5% 1% White Asian Hispanic Black Other We define our “senior leaders” as VP and above roles; “directors” encompass Director, Sr. Director, Principal, Sr. Principal and Sales VP level roles; “managers” are defined as Manager, Sr. Manager, Sales Manager, Advisor and Sr. Advisor level roles; and “admin & professionals” make up the rest of our associate population. The race/ethnicity diversity data only includes associates located in the United States, who self-identified. ‘Other’ encompasses the following associate demographics: American Indian or Alaska Native, Native Hawaiian or Other Pacific Islanders, and Two or More Races. PEOPLE AND DEI TRANSUNION | 2021 SUSTAINABILITY REPORT 34
 Sustainability Report | TransUnion Flipbook Page 33 Page 35