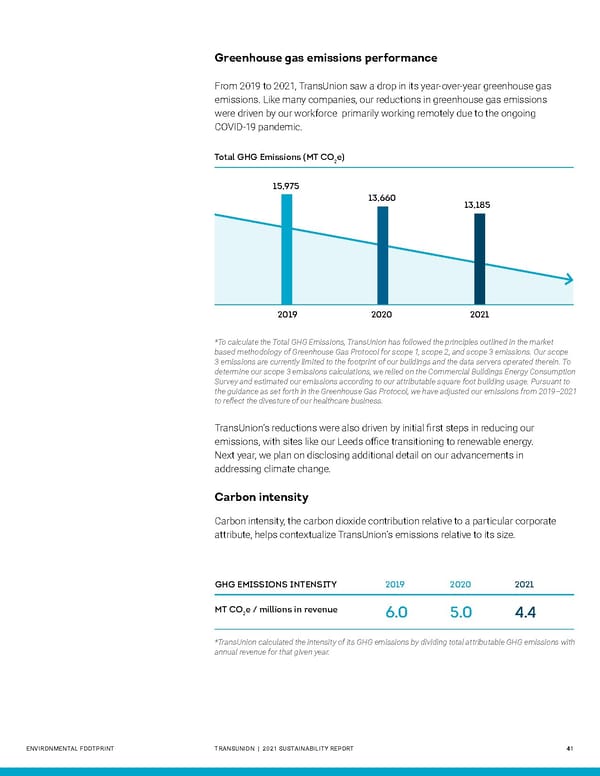
Greenhouse gas emissions performance From 2019 to 2021, TransUnion saw a drop in its year-over-year greenhouse gas emissions. Like many companies, our reductions in greenhouse gas emissions were driven by our workforce primarily working remotely due to the ongoing COVID-19 pandemic. Total GHG Emissions (MT CO e) 2 15,975 13,660 13,185 2019 2020 2021 *To calculate the Total GHG Emissions, TransUnion has followed the principles outlined in the market based methodology of Greenhouse Gas Protocol for scope 1, scope 2, and scope 3 emissions. Our scope 3 emissions are currently limited to the footprint of our buildings and the data servers operated therein. To determine our scope 3 emissions calculations, we relied on the Commercial Buildings Energy Consumption Survey and estimated our emissions according to our attributable square foot building usage. Pursuant to the guidance as set forth in the Greenhouse Gas Protocol, we have adjusted our emissions from 2019–2021 to reflect the divesture of our healthcare business. TransUnion’s reductions were also driven by initial first steps in reducing our emissions, with sites like our Leeds office transitioning to renewable energy. Next year, we plan on disclosing additional detail on our advancements in addressing climate change. Carbon intensity Carbon intensity, the carbon dioxide contribution relative to a particular corporate attribute, helps contextualize TransUnion’s emissions relative to its size. GHG EMISSIONS INTENSITY 2019 2020 2021 MT COe / millions in revenue 2 6.0 5.0 4.4 *TransUnion calculated the intensity of its GHG emissions by dividing total attributable GHG emissions with annual revenue for that given year. ENVIRONMENTAL FOOTPRINT TRANSUNION | 2021 SUSTAINABILITY REPORT 41
 Sustainability Report | TransUnion Flipbook Page 40 Page 42